Page History
...
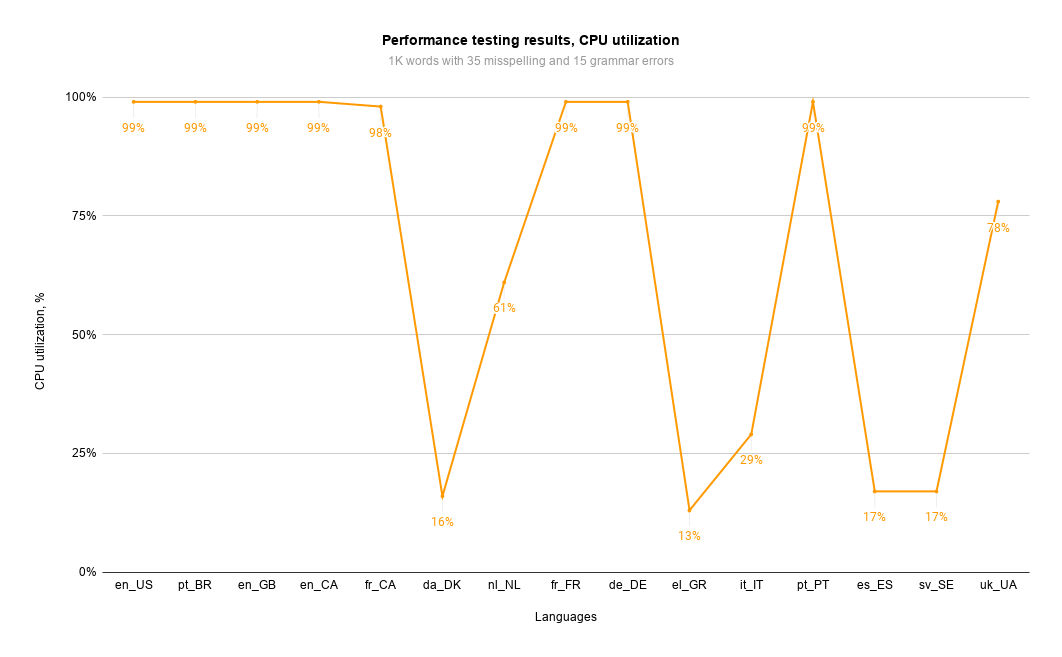
Chart below represents CPU utilization results aggregated by language and user tiers when there are 35 misspellings and 15 grammar problems in text of 1K words size.
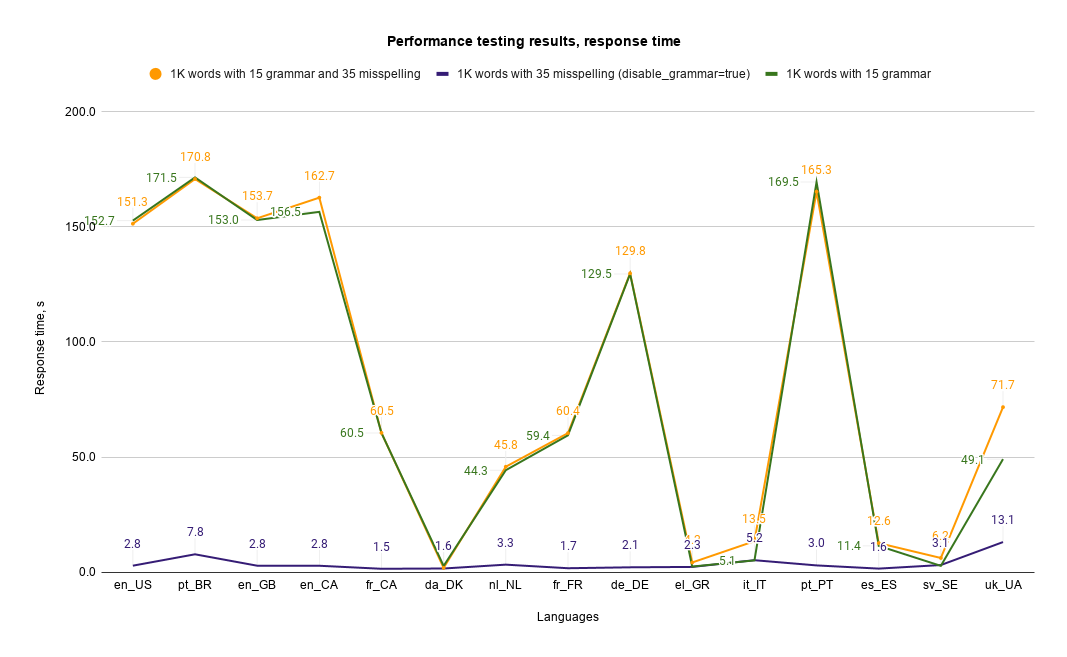
Response time and CPU utilization (three cases in one graph: 35 misspellings,15 grammar problems and both 35 misspellings and 15 grammar problems)
Chart below represents response time results aggregated by language and user tiers when there are 35 misspellings or/and 15 grammar problems in text of 1K words size.
Findings and recommendations
...